

IN Series Vessel Precision Management System
In the complex and precise industrial process of shipbuilding, precision data acquisition is undoubtedly a key link in ensuring ship quality and improving production efficiency. The adoption of modern precision data acquisition software, precision analysis and simulation loading software has become an inevitable trend in the industry. Our company successfully developed precision data acquisition and analysis software in 2016 in response to the data acquisition and analysis needs during the shipbuilding process. This software not only improves the efficiency and accuracy of data acquisition, but also provides strong data support for all aspects of shipbuilding through data analysis and processing. From design to production, assembly to quality inspection, every link is made more precise by the application of precision data acquisition and analysis software. The system is introduced below.
1. Background Introduction
In the complex and precise industrial process of shipbuilding, accurate data acquisition is undoubtedly a key link in ensuring the quality of ships and improving production efficiency. The adoption of modern precision data acquisition software, precision analysis, and simulation software has become an inevitable trend in the industry.
In 2016, our company successfully developed precision data acquisition and analysis software targeting the data acquisition and analysis needs during the shipbuilding process. This not only improves the efficiency and accuracy of data acquisition but also provides strong data support for all aspects of shipbuilding through data analysis and processing. From design to production, assembly to quality inspection, every link has become more precise due to the application of precision data acquisition and analysis software. The system is introduced below.
2. Technical Overview
The IN series software includes IN-ASSEM 3D simulation docking software, IN-ANALY 3D segment precision analysis software, and IN-CHECK on-site measurement analysis software. In the shipbuilding process, this software uses software as its core, integrating high-precision total stations and various accessories. It provides accurate measurement and quick management solutions for key links such as on-site dimension inspection, geometric quantity inspection, precision control and analysis, segment simulation docking, and overall section docking analysis.
3. System Advantages and Features
 |
 |
 |
| IN-CHECK | IN-ANALY | IN-ASSEM |
3.1 IN-CHECK Advantages and Features
◆ Based on the actual work needs of users, it is highly practical;
◆ Data is automatically recorded, operation is simple, even non-professionals can easily use it;
◆ Observation data cannot be modified, ensuring the authenticity of the results;
◆ No base station coordinates are required, arbitrary stationing (only leveling is required for setting up the total station, no centering is needed), arbitrary moving of the station, easy measurement of hidden points;
◆ Multiple coordinate system conversion algorithms allow for quick on-site verification and precision control of measured point positions and design point positions;
◆ Rich calculation functions, solving and analyzing various spatial geometric quantities on-site;
◆ Automatically corrects errors based on meteorological conditions, greatly improving data measurement accuracy;
◆ High measurement accuracy, fast speed, large measurement range, from a few meters to tens of meters or even hundreds of meters;
◆ Supports multiple types of total stations and a full range of accessories to meet the needs of various special working environments;
◆ Can be customized and functionally expanded according to user needs.
3.2 IN-ANALY Advantages and Features
◆ Supports common shipbuilding design software such as Tribon, CADDS5, CATIA, Tekla Xsteel, and Auto CAD. Data can be seamlessly integrated and updated in real-time;
◆ Precision control points can be coded and managed, and can be classified and statistically managed according to deviation range and type;
◆ Measurement results can be compensated and corrected according to component type and ambient temperature;
◆ Secondary or multiple measurement data of the same segment can be compared and analyzed;
◆ Can analyze and calculate the cutting amount of the joint, the misalignment of the reinforcing rib, and the misalignment of the mating surface;
◆ A completely independent and convenient two-three dimensional linkage precision inspection form that supports user customization;
◆ Supports automatic segment precision analysis, reducing user workload;
◆ Easy to learn and quickly put into use, cost-effective with a short return on investment.
3.3 IN-ASSEM Advantages and Features
◆ Visual 3D simulation docking for more intuitive observation and analysis;
◆ Referencing the 3D design model, simulation docking is performed based on actual segment data;
◆ Precisely analyze the docking status through functions such as rotation and movement;
◆ Automatic conditional (height, verticality, planarity) docking, automatically calculating the overlap and gap between segments;
◆ Can control the welding gap and weld shrinkage according to the process status, improving docking accuracy;
◆ Can generate a cross-sectional deviation of the docking surface with one click, which can be previewed in the software to understand the macro situation;
◆ Generates an illustrated simulation docking inspection form that supports user customization;
◆ Can connect to a precision management database to accumulate data for data statistical analysis;
4. IN Series Software Application Process
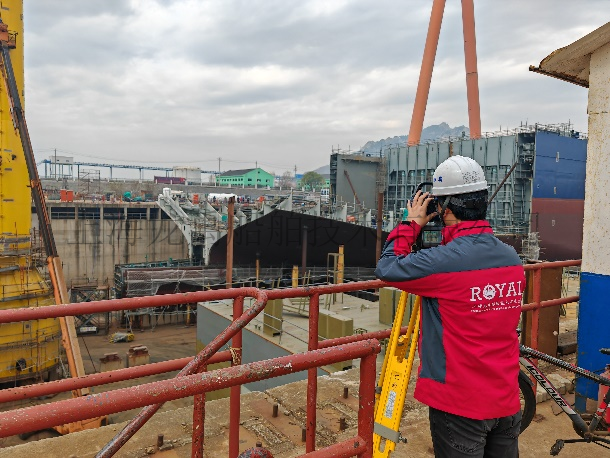
4.1 IN-CHECK Data Acquisition
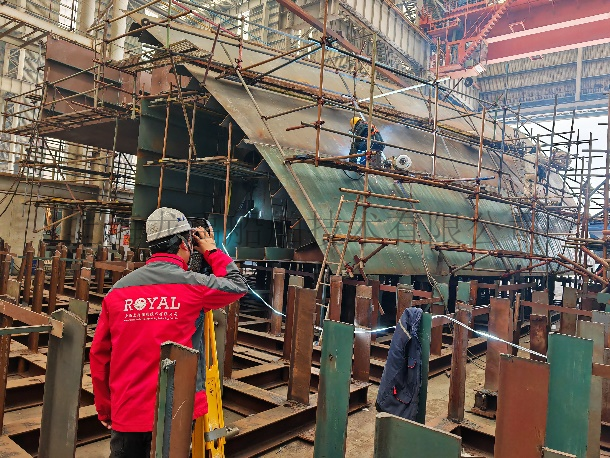
After the shipbuilding section is formed, the measurement personnel first check the site to confirm the section status, end difference, straightness, the placement of the transit target, and the instrument setup location. Use the IN-CHECK software and follow the precision planning scheme to collect point data.
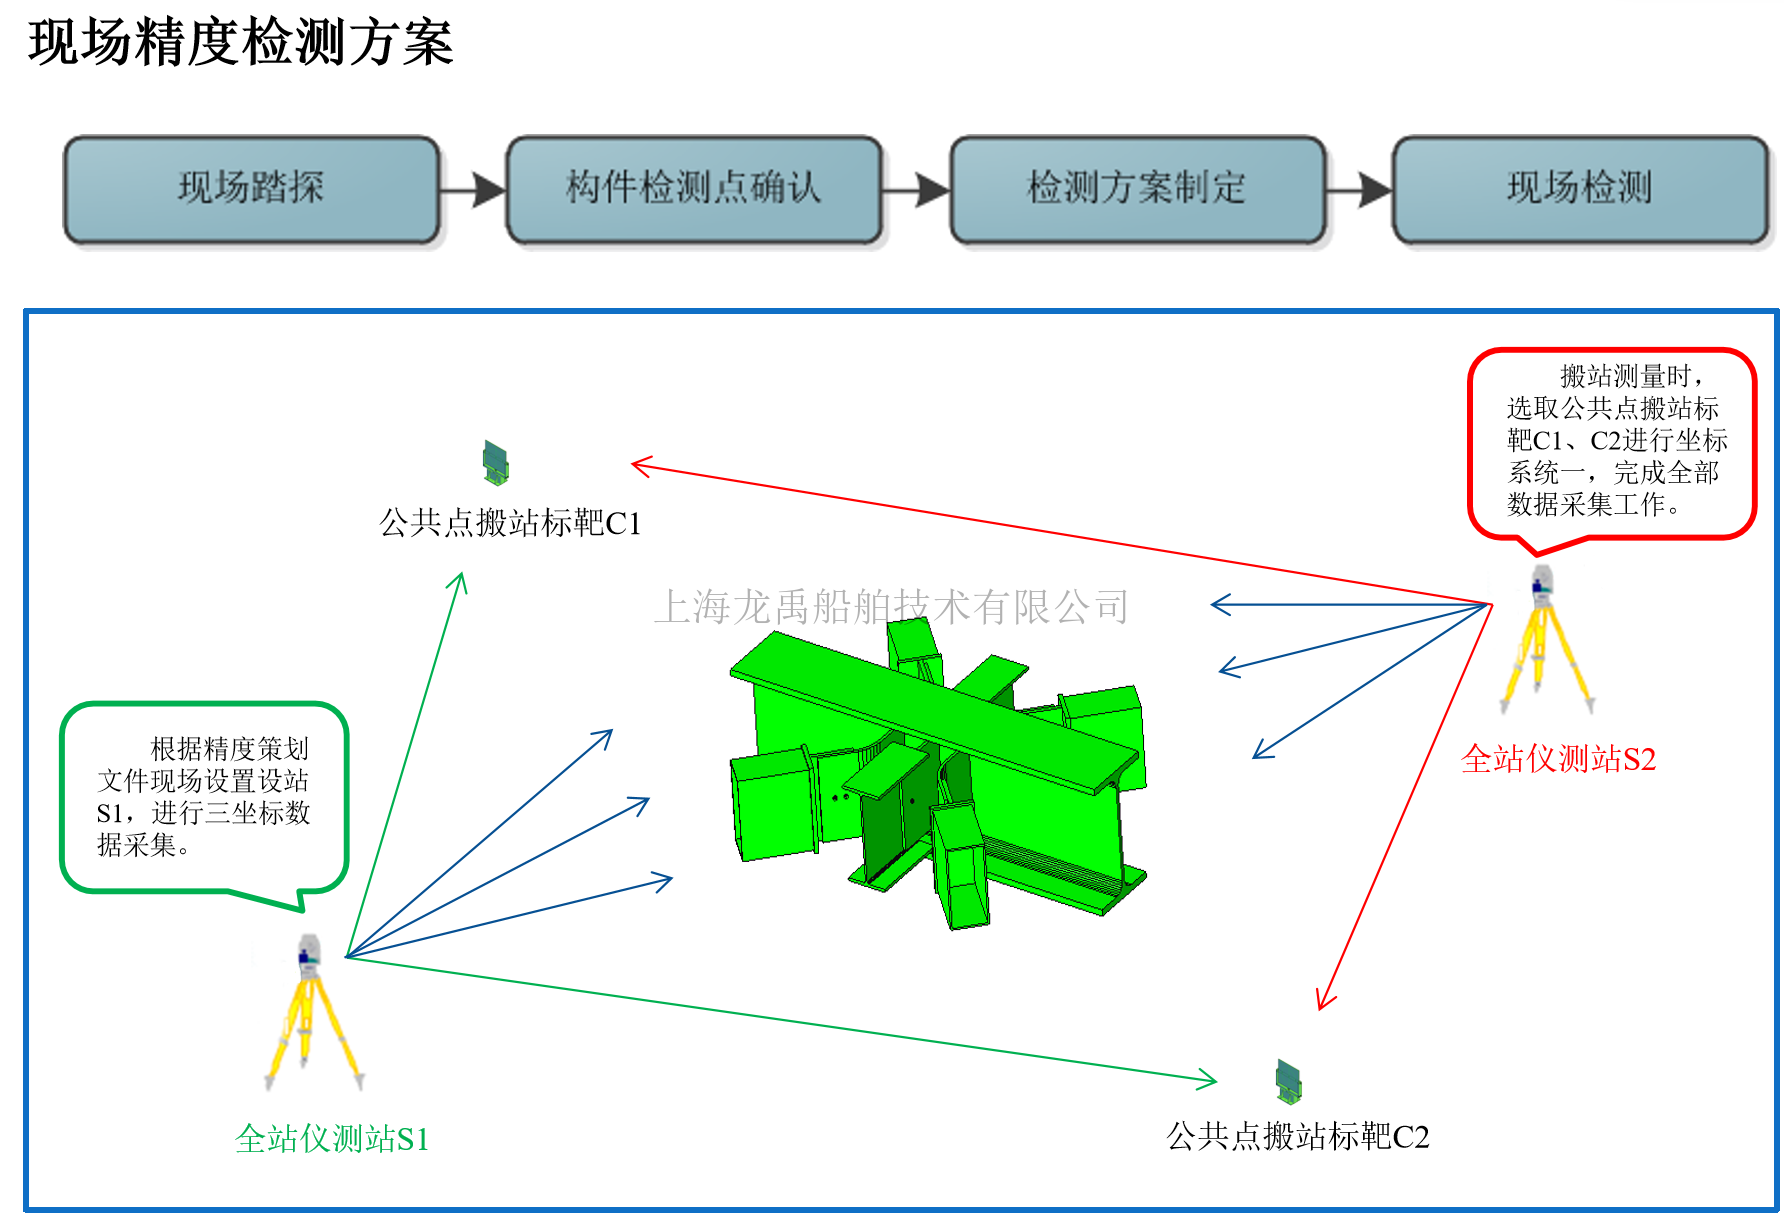
Data Acquisition Flowchart
4.1.1 Data Acquisition Process
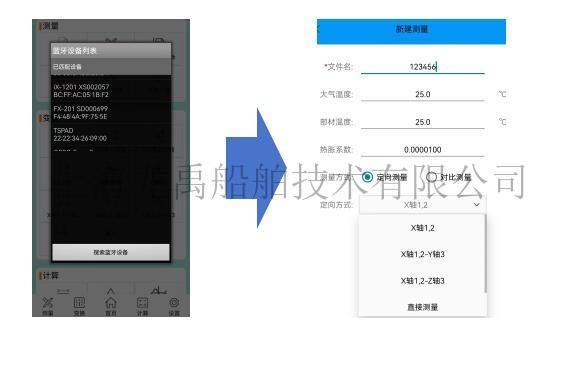
① Measurement file naming;
② Baseline axial selection;
③ Data acquisition;
④ Use the hidden rod mode for acquisition in occluded locations;
⑤ After measuring one side, switch to station measurement;
⑥ After data measurement, functions such as data transformation and calculation can be performed;


4.1.2 Data Acquisition Requirements
① The transit target must have a clear line of sight and be stable and not easily touched. If conditions permit, place the two targets at different heights (to prevent point number confusion caused by station switching after station switching);
② Before adjusting the instrument setup level, step on the tripod to ensure its stability;
③ When establishing the axis, collect points 1 and 2 on the long side of the segment. After establishing the axis, collect the transit target (to prevent the instrument from being touched during the measurement process causing a waste of working hours);
④ When using a hidden rod for measurement, keep the hidden rod target away from the measured object.
⑤After completing the single-sided or double-sided measurement in segments, before moving the station, a second measurement of the station target is required to confirm the instrument level (to prevent the station target from being touched).
⑥The instrument setup requirements for moving the station remain unchanged; the tripod legs must be firmly stepped on. The moving station accuracy is within ±0.5mm;
⑦After completing the data measurement, save the original data to the U-disk immediately (to prevent loss and modification). After saving, the measurement site data analysis can be carried out;
For functional use, please refer to the IN-CHECK software operation manual.
4.1.3 Application Scenarios of Data Acquisition Software
①Precision inspection during segmented construction
②Precision inspection of overall section joining and positioning
③Monitoring of ship floating displacement and posture

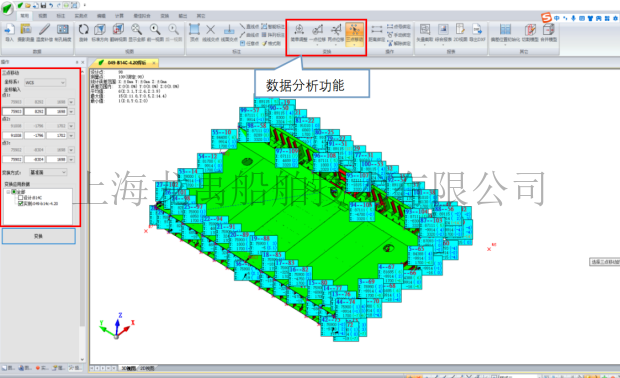
4.2 IN-ANALY Data Analysis
Based on the design-provided model, through the IN-ANALY software coordinate conversion function, the object-side coordinates and segment design coordinates are matched, and the fixed benchmark point analysis method (or the dispersed benchmark method) is used to obtain the deviation between the field data and the theoretical data. This allows for understanding of the on-site work and realizing the digitalization, visualization, and automation of measurement and analysis tasks, greatly reducing the cost of on-site precision rework and improving construction efficiency.
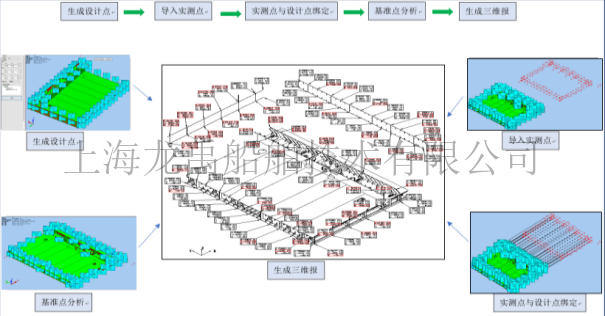
3D Analysis Flowchart
4.2.1 Data Analysis Process
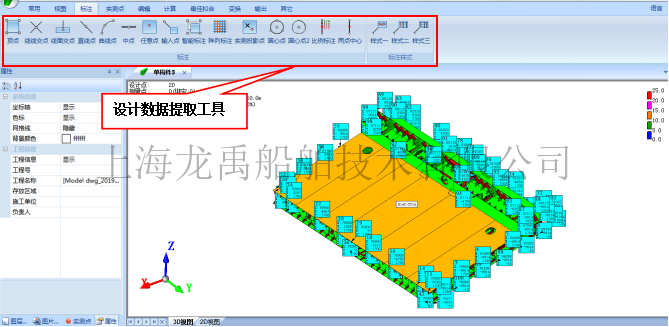
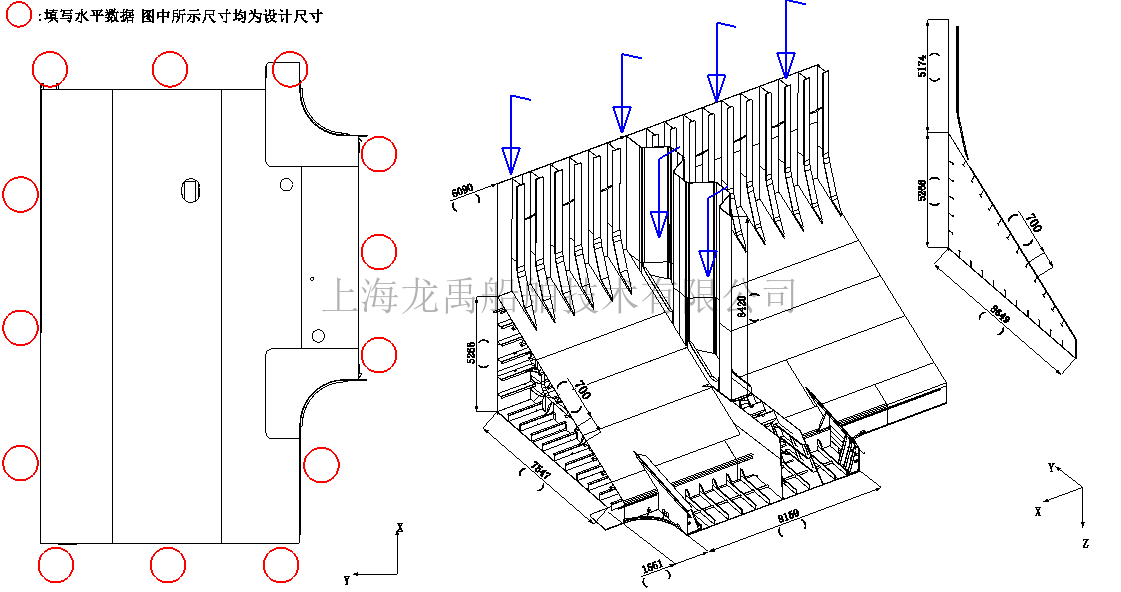
①Extraction of design points
Use the annotation function in the IN-ANALY software to annotate the design points on the model according to the data acquisition location.
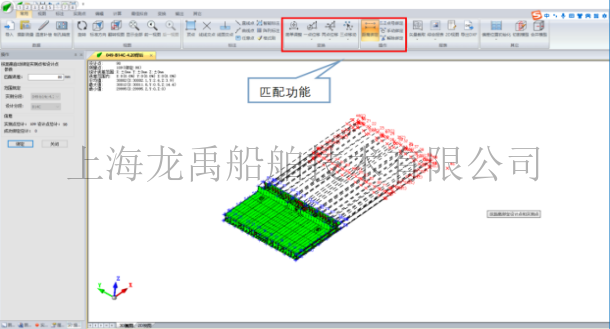
②Matching of measured data with design data
Use the model analysis software IN-ANALY to match the measured data with the design data. This ensures that the on-site measurement points match the design model points, accurately reflecting the posture of the actual physical segment on site.
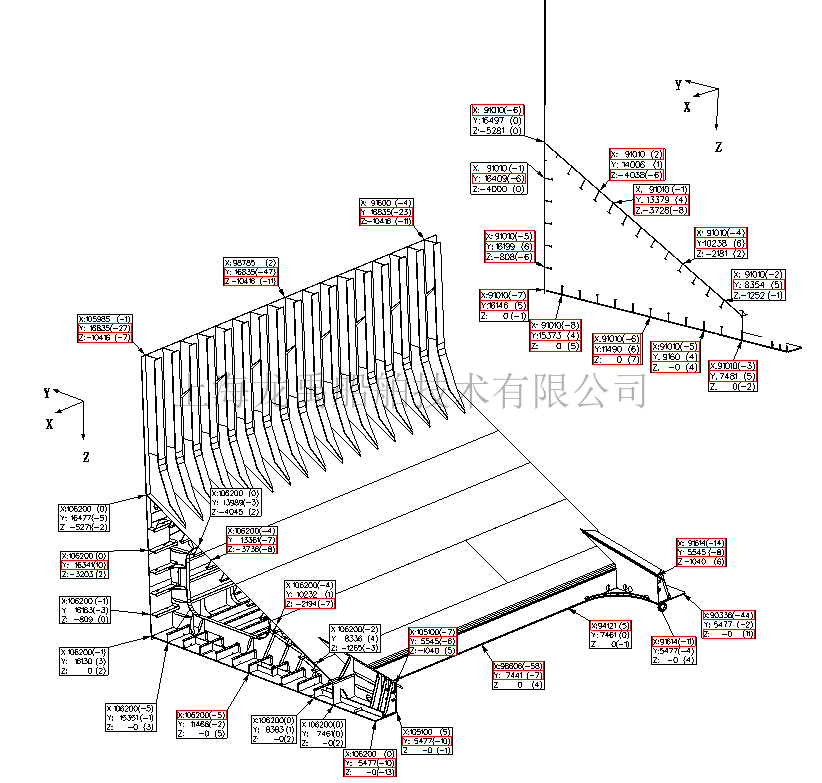
③Data error analysis
The deviation is calculated by binding the measured points and the design points. (Error = measured value - design value). Data error analysis can be performed according to the actual on-site situation, i.e., the determination of the analysis benchmark. The analysis benchmark point position is combined with the on-site production process, using artificially set construction benchmark points on the segments. During the 3D data analysis process, analysis must be performed according to the benchmark points, effectively and accurately reflecting the manufacturing situation of the on-site components.

④Generation of 2D report
After optimal data analysis, an effective and accurate inspection report is generated. The inspection report can include: 3D report of segment workshop placement posture (coordinate system conversion), 3D report of design theoretical posture (original overall coordinate system), EXCEL 3D report, 2D dimension report. The on-site production is guided according to the error data.
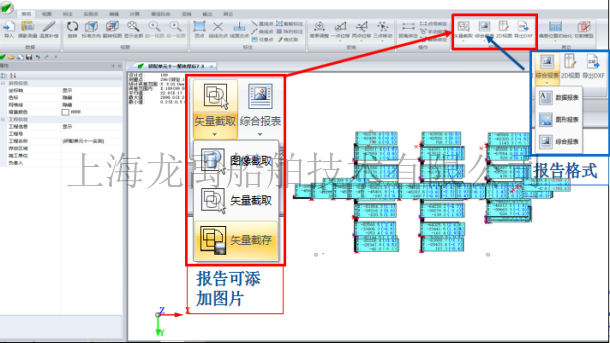
The IN-ANALY software can edit the report data according to customer needs for the selection of inspection items.

For functional use, please refer to the IN-ANALY software operation manual.
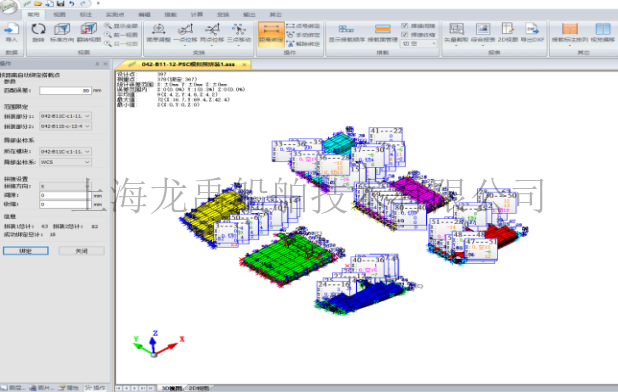
4.3 IN-ASSEM Simulation Docking
After the final precision inspection of the segments after welding, computer-aided simulation docking can be performed based on this data. During data simulation, the bottom segment is used as the benchmark (selecting two measured points for comparison or comparing the errors of two measured points), and the overlap and interference (cutting/gap), vertical and horizontal displacement between adjacent segments are simulated in sequence, and the segments are pre-corrected/cut according to the simulation results, and the docking positioning is guided according to the docking results, reducing the total assembly docking time of the segments and improving overall efficiency.
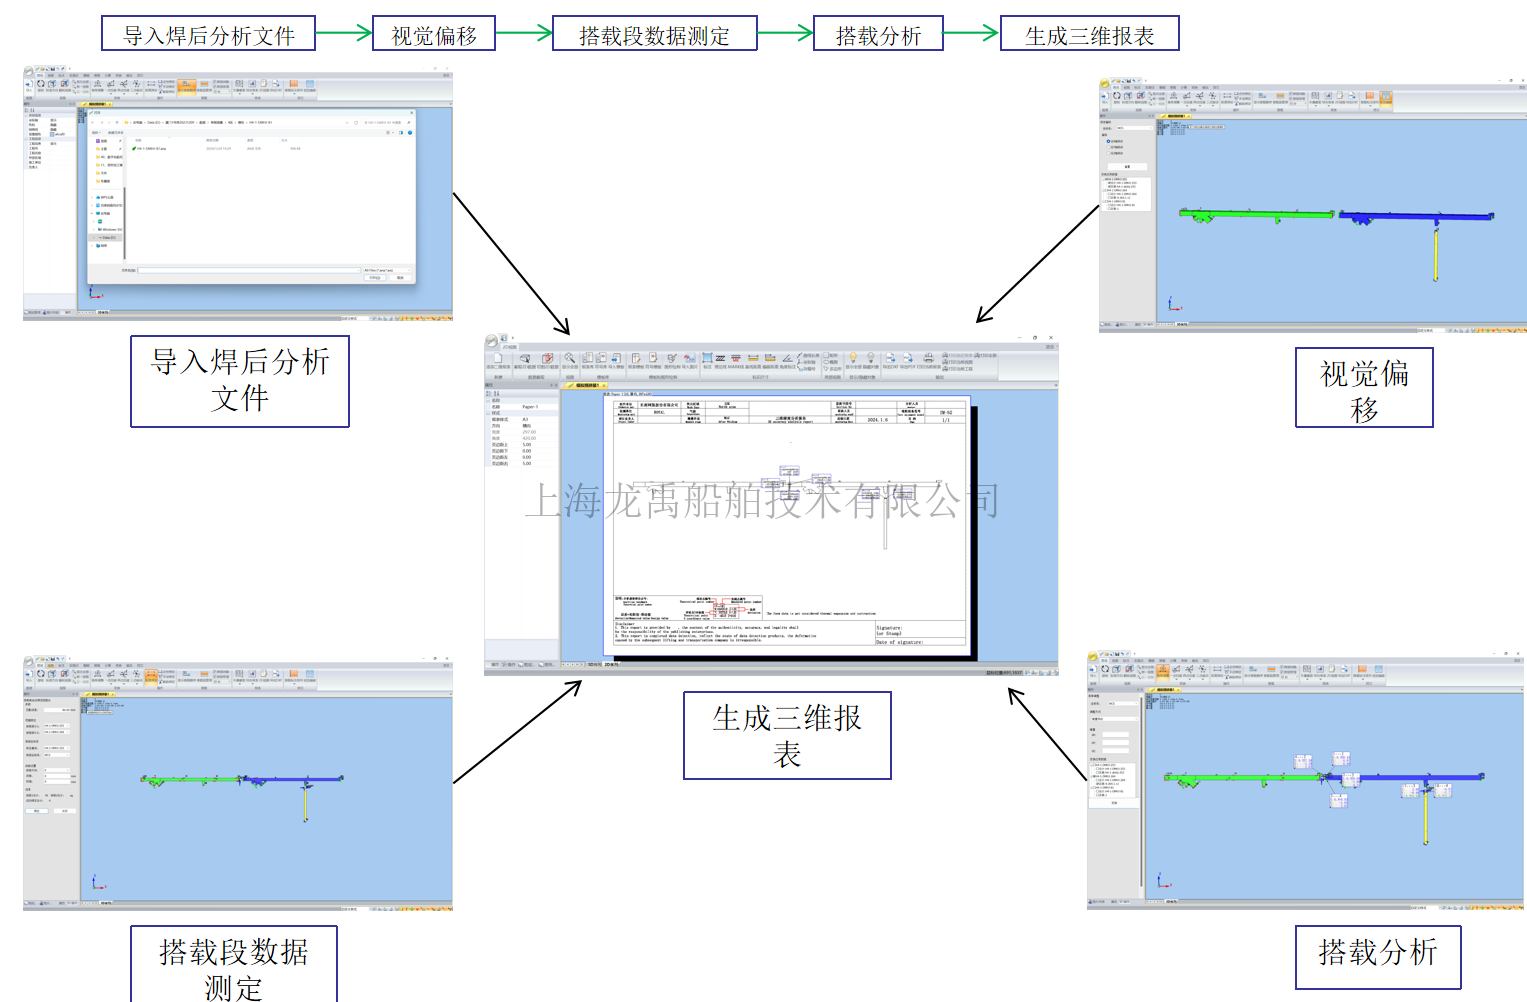
Simulation Docking Flowchart
4.3.1 Simulation Docking Process
①Data import
Import the final analysis report of adjacent segments from IN-ANALY into the IN-ASSEM simulation docking software. Import the docking benchmark segment analysis file, then import other docking segments in the simulation docking order. Multiple sets of data can be imported simultaneously.
②Data matching
Set the docking benchmark segment for binding and visual deviation settings.
③Data analysis
During simulation docking data analysis, the main scale is used as the analysis benchmark. Reference structures check whether the interface spacing, port coplanarity, and spatial coordinates of subsequent docking connections meet design requirements. If the docking deviation data is unsatisfactory and needs adjustment, the segment that needs adjustment can be selected, and the segment posture can be appropriately adjusted according to the docking deviation.
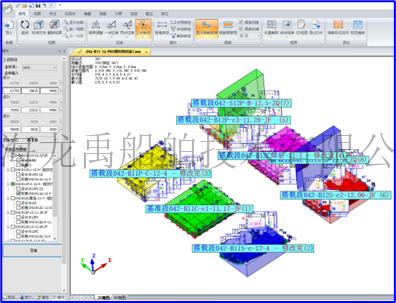
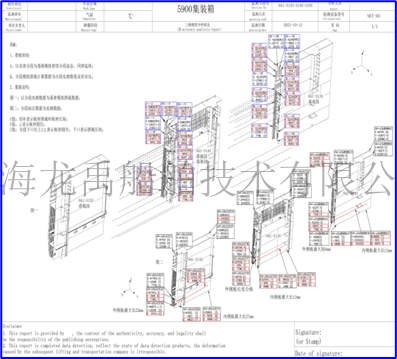
④Report generation
After optimal data analysis, an effective and accurate inspection report is generated. The on-site production is guided according to the error data. The inspection report can include: 3D report (coordinate system conversion), EXCEL 3D report, 2D dimension report, etc.
4.3.2 Simulation Docking Requirements
①The report clearly indicates the benchmark and docking segments;
②The simulation docking comparison mode is clearly defined;
③The simulation docking report must include the segment posture after simulation;
④For a large amount of simulation docking data, the model merging function of the analysis software can be used to reduce the file size before importing the IN-ANALY file, which can effectively increase computer operating efficiency.
The above software is used in more than 200 large and medium-sized shipbuilding and steel structure manufacturing enterprises in China. Welcome to purchase our company's IN series precision management system. We hope to bring you a better user experience.
Company Address: Room 201, Building 11, No. 299, Bisheng Road, Pudong New District, Shanghai
Company Telephone:021-33830252
Company Fax: 021-33830253
Company Postcode: 201204
Company Email:service@shipac.com.cn